
Joining an existing project with a large codebase can be a daunting task.
Understanding the data model of an application is key for developers to start working on an existing project. One commonly used tool to help overcome this challenge, and enable developers to grasp an application's data model is an ER (Entity Relation) diagram.
ER diagrams provide a visual representation of your data model, and details each field of the entities. Many tools can help create these, where one example is Jetbrains DataGrip, that can generate an ER diagram by connecting to and inspecting an existing database:
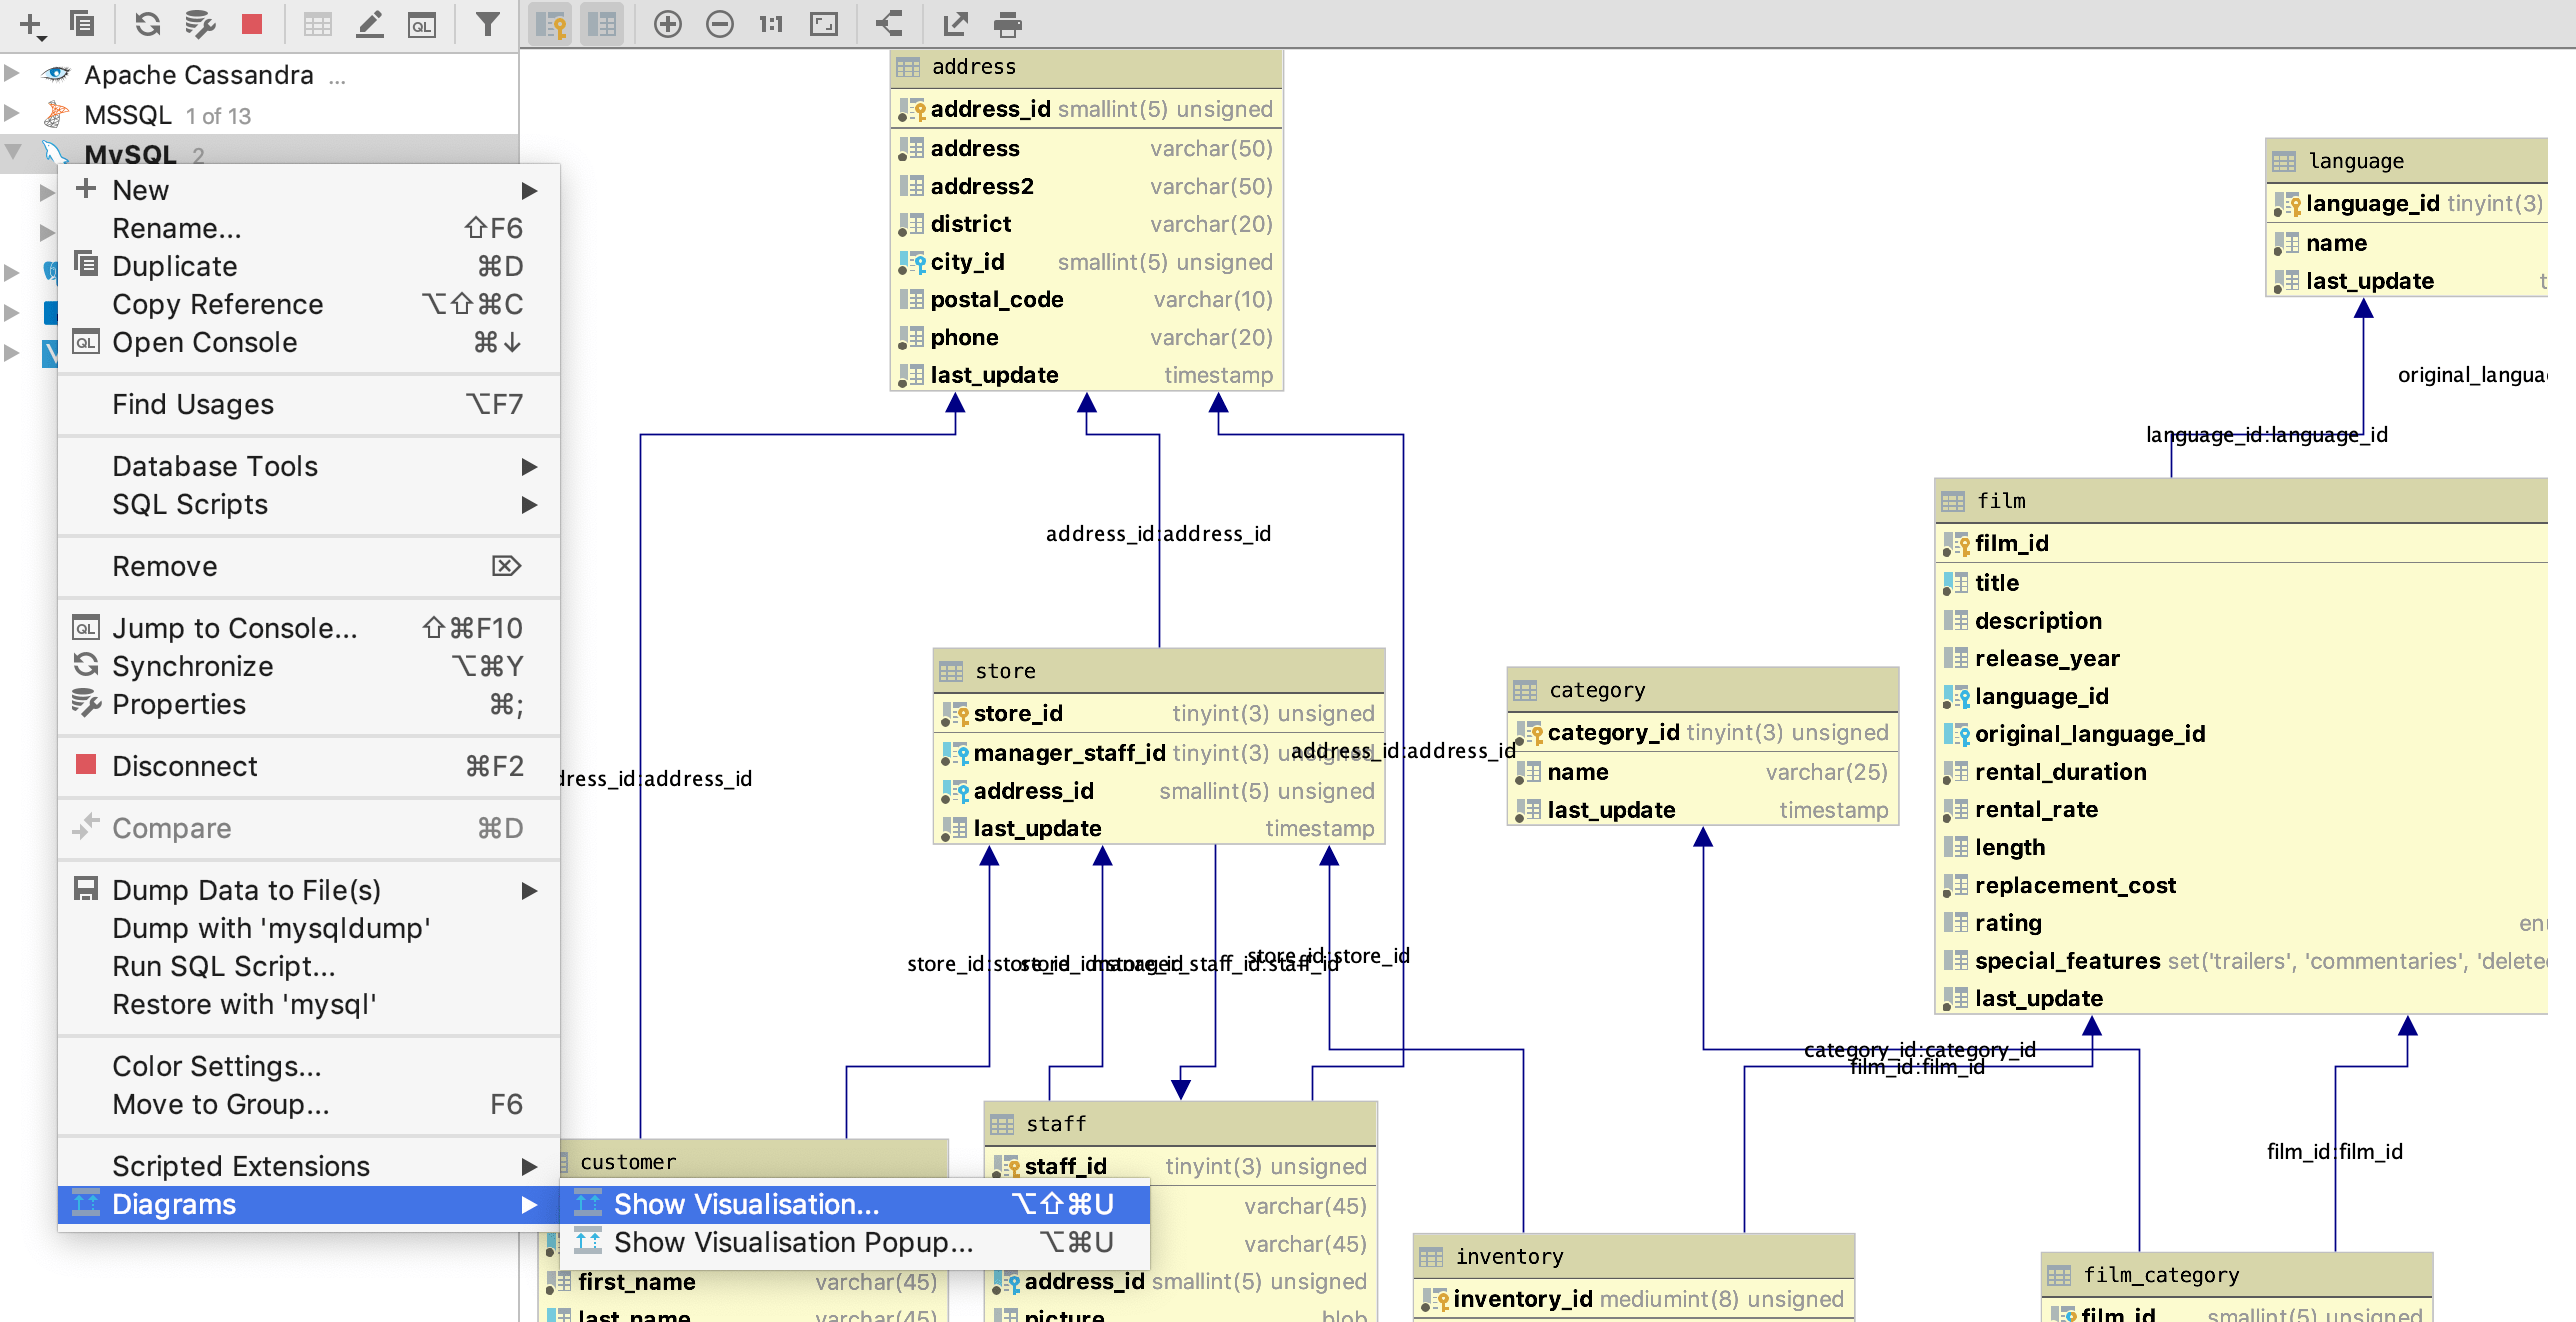
DataGrip ER diagram example
Ent, a simple, yet powerful entity framework for Go, was originally developed inside Facebook specifically for dealing with projects with large and complex data models. This is why Ent uses code generation - it gives type-safety and code-completion out-of-the-box which helps explain the data model and improves developer velocity. On top of all of this, wouldn't it be great to automatically generate ER diagrams that maintain a high-level view of the data model in a visually appealing representation? (I mean, who doesn't love visualizations?)
Introducing entviz
entviz is an ent extension that automatically generates a static HTML page that visualizes your data graph.
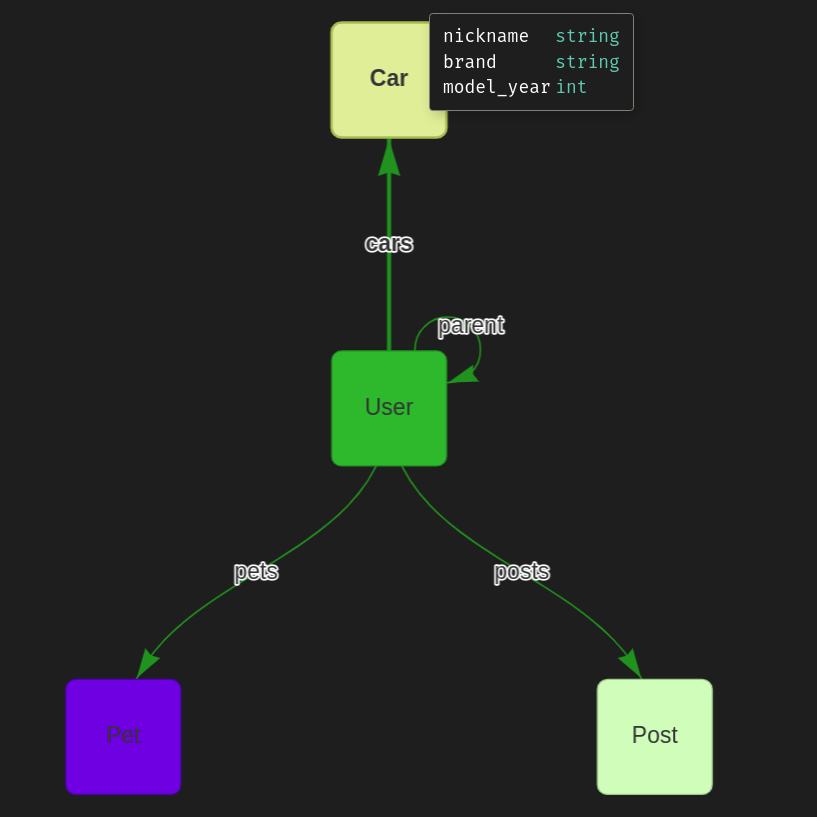
Entviz example output
If you want to know more about how entviz was implemented, checkout the implementation section.
See it in action
First, let's add the entviz extension to our entc.go file:
go get github.com/hedwigz/entviz
entc you're welcome to read entc documentation to learn more about it. :::import (
"log"
"entgo.io/ent/entc"
"entgo.io/ent/entc/gen"
"github.com/hedwigz/entviz"
)
func main() {
err := entc.Generate("./schema", &gen.Config{}, entc.Extensions(entviz.Extension{}))
if err != nil {
log.Fatalf("running ent codegen: %v", err)
}
}
Let's say we have a simple schema with a user entity and some fields:
// Fields of the User.
func (User) Fields() []ent.Field {
    return []ent.Field{
        field.String("name"),
        field.String("email"),
        field.Time("created").
            Default(time.Now),
    }
}
Now, entviz will automatically generate a visualization of our graph everytime we run:
go generate ./...
You should now see a new file called schema-viz.html in your ent directory:
$ ll ./ent/schema-viz.html
-rw-r--r-- 1 hedwigz hedwigz 7.3K Aug 27 09:00 schema-viz.html
Open the html file with your favorite browser to see the visualization

Next, let's add another entity named Post, and see how our visualization changes:
ent new Post
// Fields of the Post.
func (Post) Fields() []ent.Field {
    return []ent.Field{
        field.String("content"),
        field.Time("created").
            Default(time.Now),
    }
}
Now we add an (O2M) edge from User to Post:
// Edges of the User.
func (User) Edges() []ent.Edge {
    return []ent.Edge{
        edge.To("posts", Post.Type),
    }
}
Finally, regenerate the code:
go generate ./...
Refresh your browser to see the updated result!

Implementation
Entviz was implemented by extending ent via its extension API. The Ent extension API lets you aggregate multiple templates, hooks, options and annotations. For instance, entviz uses templates to add another go file, entviz.go, which exposes the ServeEntviz method that can be used as an http handler, like so:
func main() {
    http.ListenAndServe("localhost:3002", ent.ServeEntviz())
}
We define an extension struct which embeds the default extension, and we export our template via the Templates method:
//go:embed entviz.go.tmpl
var tmplfile string

type Extension struct {
    entc.DefaultExtension
}

func (Extension) Templates() []*gen.Template {
    return []*gen.Template{
        gen.MustParse(gen.NewTemplate("entviz").Parse(tmplfile)),
    }
}
The template file is the code that we want to generate:
{{ define "entviz"}}

{{ $pkg := base $.Config.Package }}
{{ template "header" $ }}
import (
    _ "embed"
    "net/http"
    "strings"
    "time"
)

//go:embed schema-viz.html
var html string

func ServeEntviz() http.Handler {
    generateTime := time.Now()
    return http.HandlerFunc(func(w http.ResponseWriter, req *http.Request) {
        http.ServeContent(w, req, "schema-viz.html", generateTime, strings.NewReader(html))
    })
}
{{ end }}
That's it! now we have a new method in ent package.
Wrapping-Up
We saw how ER diagrams help developers keep track of their data model. Next, we introduced entviz - an Ent extension that automatically generates an ER diagram for Ent schemas. We saw how entviz utilizes Ent's extension API to extend the code generation and add extra functionality. Finally, you got to see it in action by installing and use entviz in your own project. If you like the code and/or want to contribute - feel free to checkout the project on github.
Have questions? Need help with getting started? Feel free to join our Discord server or Slack channel.
- Subscribe to our Newsletter
- Follow us on Twitter
- Join us on #ent on the Gophers Slack
- Join us on the Ent Discord Server
:::